Error reporting
To view this content, buy the book! 😃🙏
Or if you’ve already purchased.
Error reporting
If you’re jumping in here,
git checkout 28_0.2.0(tag 28_0.2.0, or compare 28...29)
In this section we’ll look at what kind of error reporting Apollo Studio covers, and then we’ll look at a dedicated error reporting service.
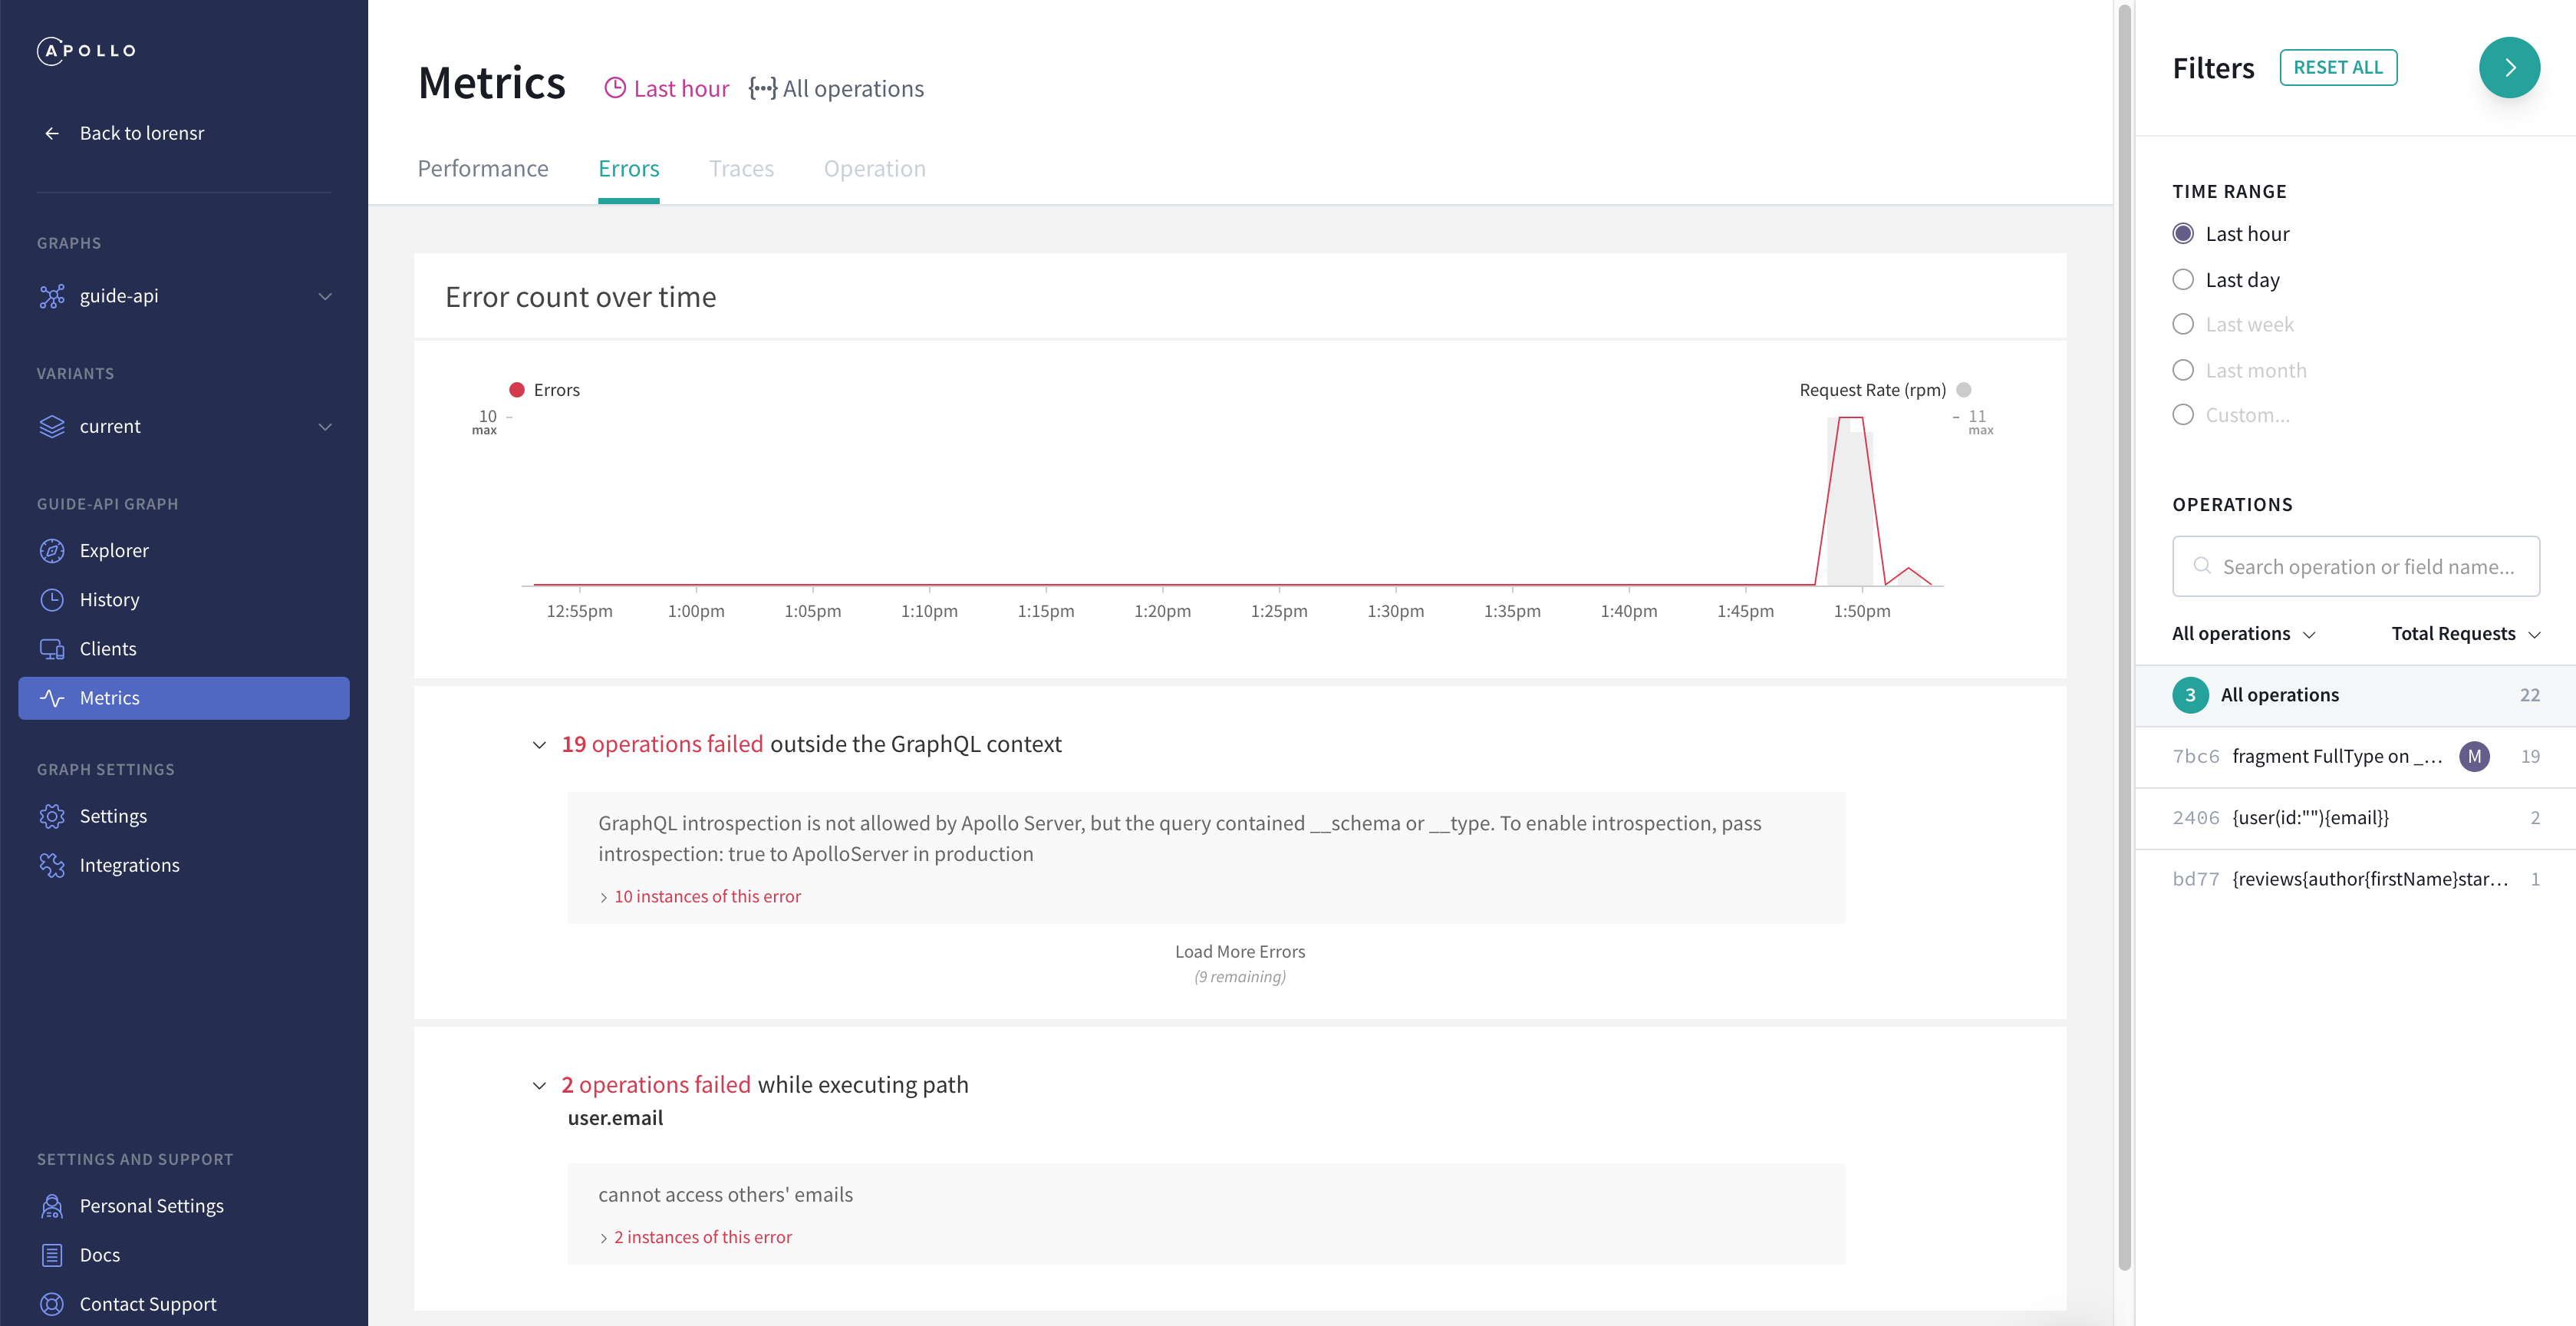
In the last section we set up Apollo Studio and looked at its analytics. The one tab of the Metrics page we didn’t get to is the Errors tab:

The general errors page (without an operation selected) shows a timeline of total error count, followed by a list of all errors within the current time range, grouped by where they occurred—either in a specific resolver, like the user.email errors at the bottom, or before the server starts calling resolvers (labeled as “outside of the GraphQL context” above). The latter category often includes failures parsing or validating the request’s operation. In this example, the validation fails because the operation includes a __schema root Query field, but the field is not in the schema because introspection is turned off.
We can expand the instances links to get a list of times and operations in which the error occurred:

And when we have an operation selected, the Errors tab only shows us errors that occurred during the execution of that operation.
There are a few features that Apollo Studio doesn’t have that would be useful:
- Stack traces
- The contents of the
extensionsfield of the GraphQL error (above we only see themessagefield) - The ability to attach further information, like the current user
- The ability to ignore errors or mark them as fixed
- Team features like the ability to attach notes or assign errors to people
- The ability to search through the errors
There are a few error-tracking services that provide these features. We’ll set up Sentry—one of the most popular ones—but setting up another service would work similarly.
First we create an account, and then we create our first Sentry project, choosing Node.js as the project type. We’re given a statement like Sentry.init({ dsn: 'https:://...' }) with our new project’s ID filled in, which we paste into our code:
import * as Sentry from '@sentry/node'

Sentry.init({
  dsn: 'https://[email protected]/5168151'
})
Now Sentry automatically gathers uncaught errors like this one:
Sentry.init({
  dsn: 'https://[email protected]/5168151'
})

myUndefinedFunction()
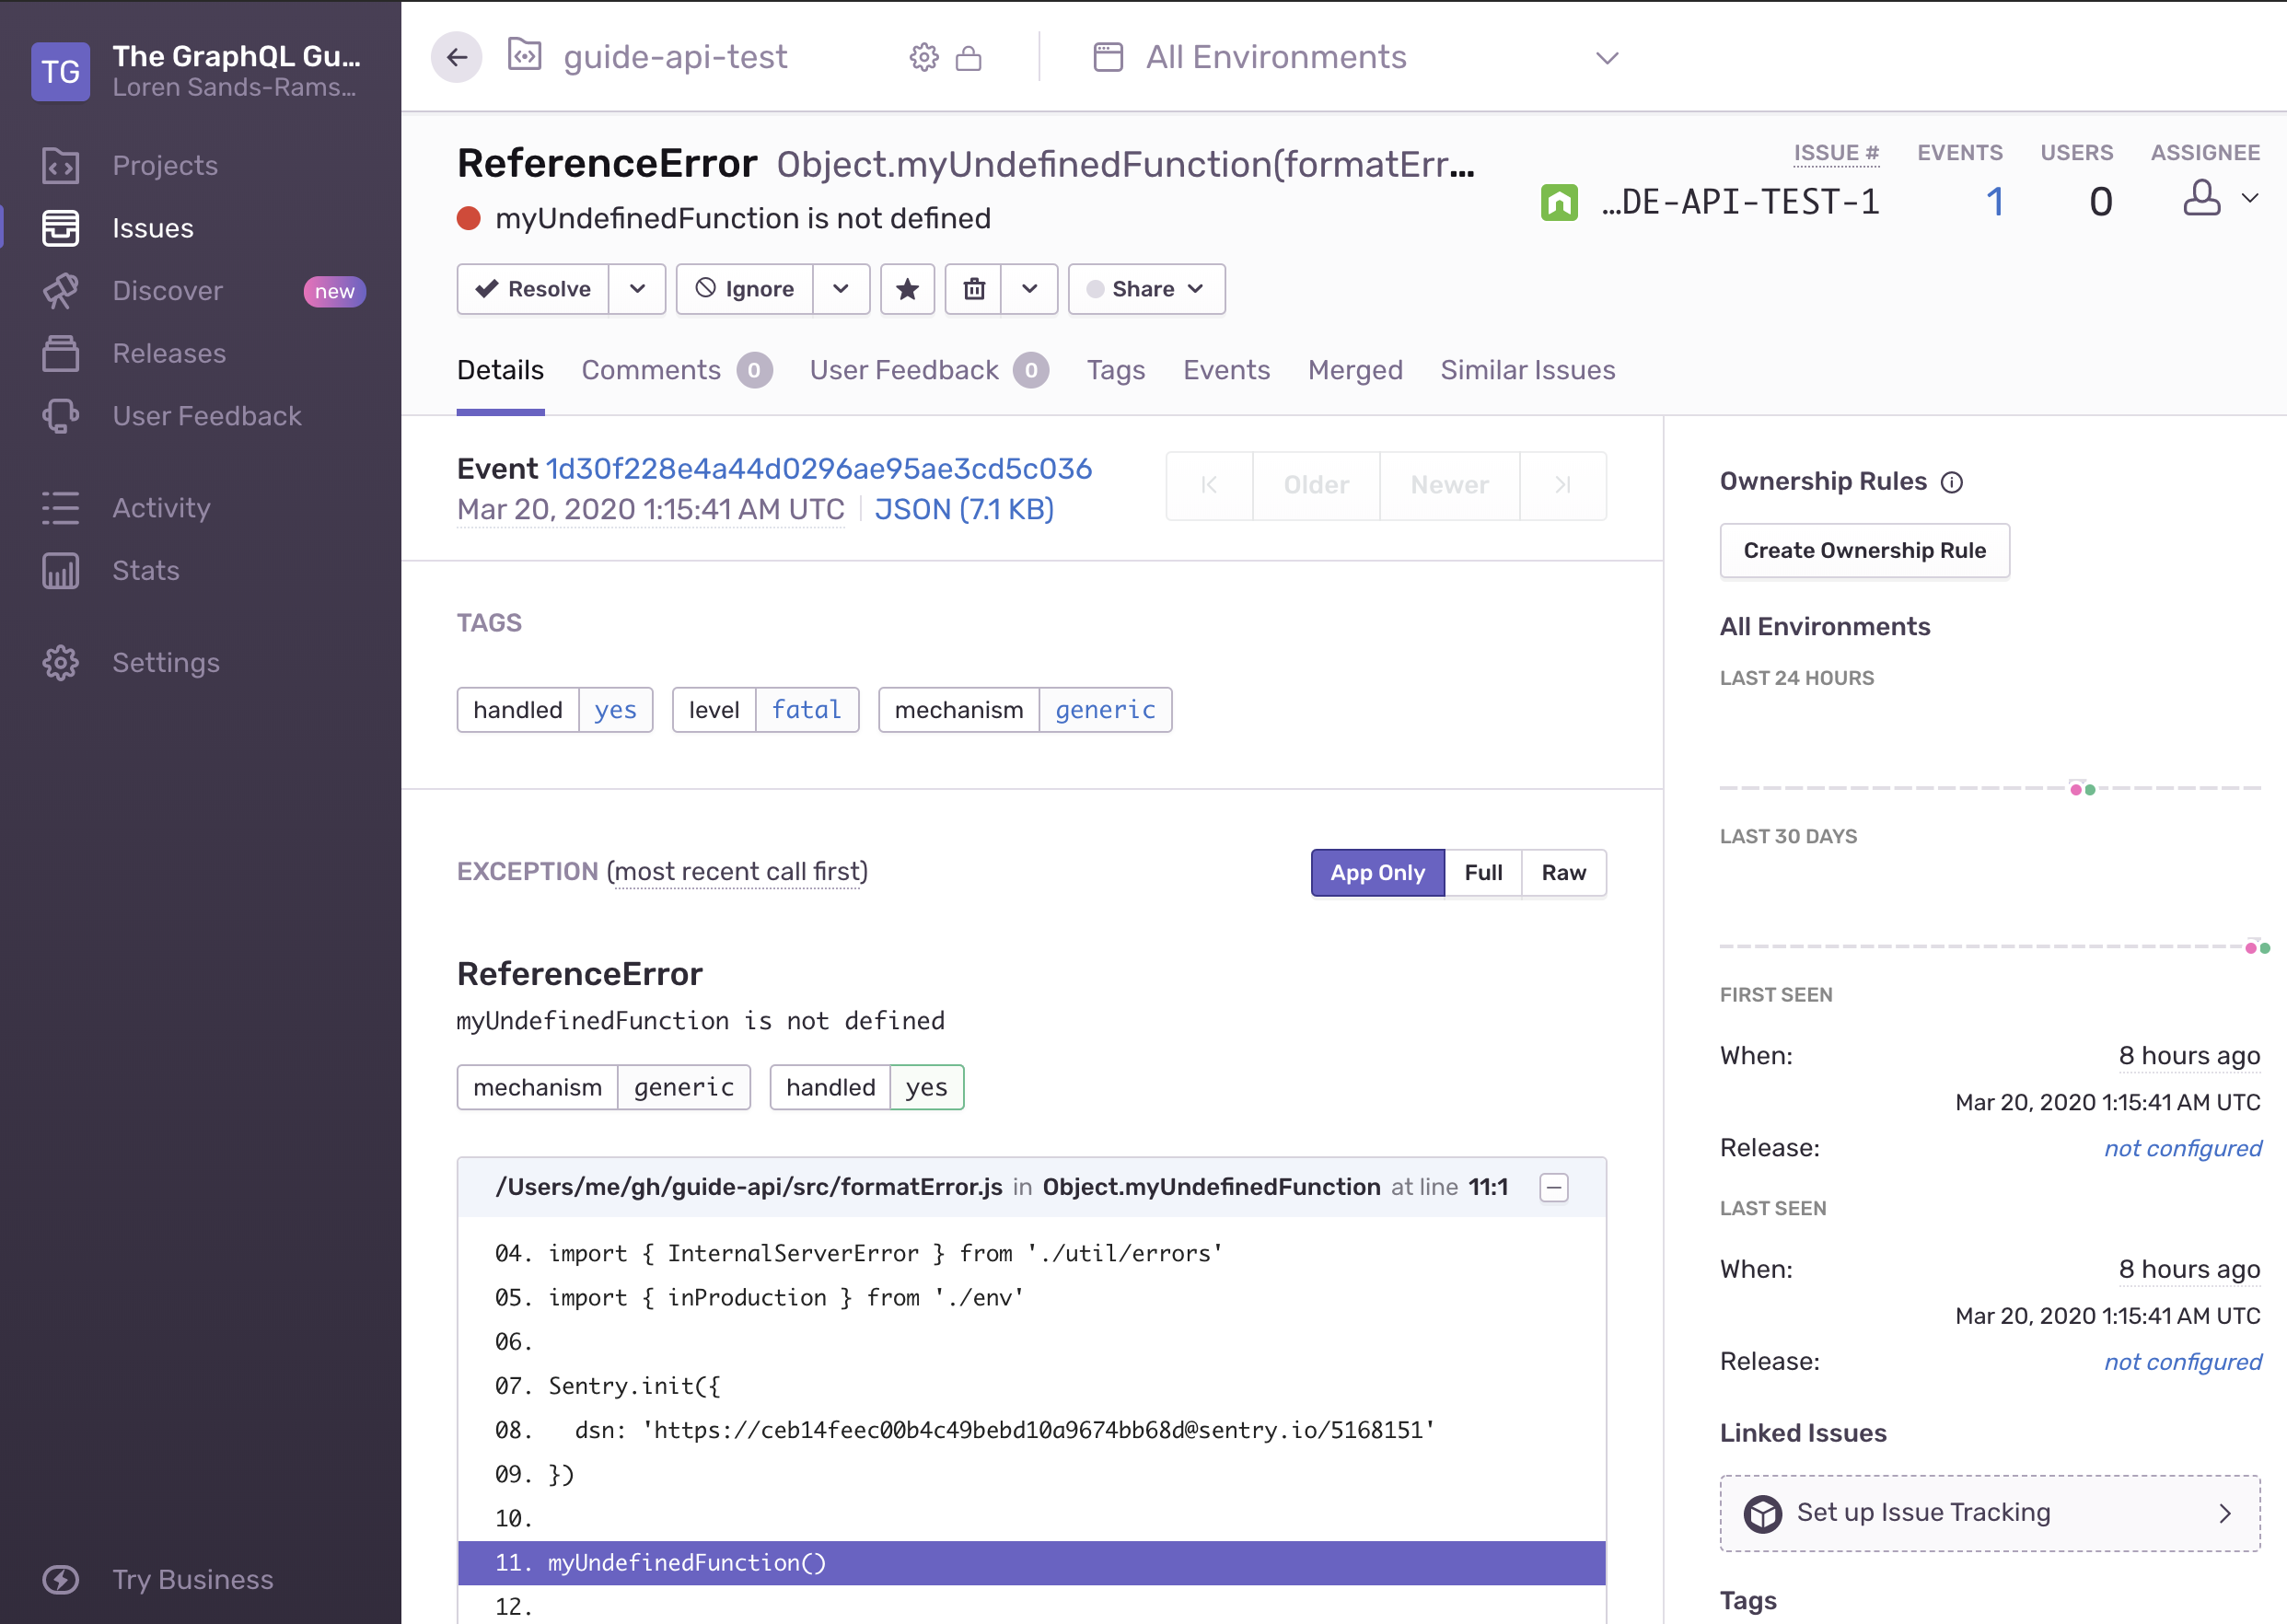
Within seconds of npm run dev, we should see a new error in our Sentry dashboard:

We see the time, error message, stack trace, and line of code. And if the same error happens again, it will be grouped with this one so that we can see the total number of occurrences and graph occurrences over time.
This is all really useful, but the issue is that Apollo Server catches all errors that occur during GraphQL requests, which is where most of our errors will occur. Since Sentry is only gathering uncaught errors, it misses most of our errors. To tell Sentry about those errors, we can use one of two ApolloServer() options:
formatErrorfunctionpluginsarray with a new plugin we write
The first is simpler, and we’re already using it:
import formatError from './formatError'

const server = new ApolloServer({
  typeDefs,
  resolvers,
  dataSources,
  context,
  formatError,
  cache
})export default error => {
if (inProduction) {
// send error to tracking service
} else {
console.log(error)
console.log(get(error, 'extensions.exception.stacktrace'))
}
const name = get(error, 'extensions.exception.name') || ''
if (name.startsWith('Mongo')) {
return new InternalServerError()
} else {
return error
}
}We’re currently using the formatError() function to log errors in development and mask errors involving MongoDB. We can call Sentry.captureException() to tell Sentry about errors:
import get from 'lodash/get'
import * as Sentry from '@sentry/node'
import { AuthenticationError, ForbiddenError } from 'apollo-server'

import { InternalServerError, InputError } from './util/errors'

const NORMAL_ERRORS = [AuthenticationError, ForbiddenError, InputError]
const NORMAL_CODES = ['GRAPHQL_VALIDATION_FAILED']
const shouldReport = e =>
  !NORMAL_ERRORS.includes(e.originalError) &&
  !NORMAL_CODES.includes(get(e, 'extensions.code'))

export default error => {
  if (inProduction) {
    if (shouldReport(error)) {
      Sentry.captureException(error.originalError)
    }
  } else {
    console.log(error)
    console.log(get(error, 'extensions.exception.stacktrace'))
  }

  ...
}
The error the function receives is the GraphQL error that’s included in the response to the client. To get the Node.js error object (which is what Sentry expects), we do error.originalError. We also use shouldReport() to avoid reporting normal errors, like auth and query format errors, since we don’t need to track and fix them.
If we had a public API, we might want to track query-parsing errors in case we find that developers consistently make certain mistakes, in which case we could try to improve our schema or documentation.
To test, we can run NODE_ENV=production npm run dev and add an error to Query.hello:
const resolvers = {
  Query: {
    hello: () => '🌍🌏🌎' && myUndefinedFunction(),
    isoString: (_, { date }) => date.toISOString()
  }
}
We can see the error message is the same, but the new entry shows a different function and file: hello(resolvers:index).
If we want to track more information in Sentry, like details about the request and context (such as the current user), then we need to use a plugin instead of formatError. We use the plugins option:
const server = new ApolloServer({
  typeDefs,
  resolvers,
  dataSources,
  context,
  formatError,
  cache,
  plugins: [sentryPlugin]
})
And we create sentryPlugin according to the plugin docs, defining the didEncounterErrors() method and using Sentry.withScope().
One last thing to consider is that if our server is not running—if something happened to our Node.js process or our machine—we won’t receive errors in Sentry. In many cases we won’t need to worry about this: for instance, a Node.js PaaS will automatically monitor and restart the process, and for a FaaS, it’s irrelevant. But if it is relevant for our deployment setup, we can use an uptime / monitoring service that pings our server to see if it’s still reachable over the internet and responsive. The URL we can use for that (as well as for a load balancer, if we’re using one) is /.well-known/apollo/server-health, which should return status 200 and this JSON:
