Server Analytics
To view this content, get the Pro package! 😃🙏
Or if you’ve already purchased.
Server Analytics
If you’re jumping in here,
git checkout 28_0.1.0(tag 28_0.1.0).
There are different types of server analytics that can be useful to track and a variety of tools that gather and display data.
The types of analytics can be split into two categories: those at the operating system (OS) level, and those at the code level.
At the OS level, there are:
- Memory usage
- CPU usage
- Request statistics, which include:
- Rate (e.g. 1000 requests received per second)
- Response times (e.g. 95% of responses are sent within 100ms of receiving the request)
- Error rates (e.g., 1% of responses have an HTTP code in the 500-599 range)
The code level can also measure things based on details in the code: for instance, Express route names or GraphQL field usage. A popular application performance management (APM) tool that can do code-level measurement is [New Relic], which has an npm library that tracks requests by route name for a list of supported frameworks like Express. It also can monitor the performance of calls to several different databases, and it provides functions for custom instrumentation/metrics.
The main APM tool for GraphQL servers is Apollo Studio (formerly known as Graph Manager, Engine, and Optics 😄), which tracks the request statistics listed above, as well as:
- Queries received
- Fields selected
- Resolver timelines
- Clients
- Deprecated field usage
- GraphQL errors
For memory and CPU usage, we could either use Heroku’s built-in metrics or New Relic. However, these OS-level metrics are becoming less important, given the prevalence of autoscaling (where the PaaS automatically adds more containers when under a high load) and serverless (where we usually don’t have to think about memory and CPU).
For the rest of the metrics, let’s set up Apollo Studio. First, we sign up, and then we’re given an API key to set for the APOLLO_KEY env variable:
.env
APOLLO_KEY=service:guide-api:*****We now start our server with npm run dev. Once it has finished starting up, we run this command in a new terminal:
$ npx apollo service:push --endpoint="http://localhost:4000"This command sends Apollo our schema, which is used for GraphQL analytics and other Apollo Studio features like schema change validation. When we change our schema, we need to re-run the command. Usually this is done automatically as part of continuous integration (CircleCI example).
Now we can make queries in Playground, reload Studio, select “Metrics” from the menu, and see server analytics!
If we only want to see production analytics, we can remove APOLLO_KEY from .env and set it on Heroku:
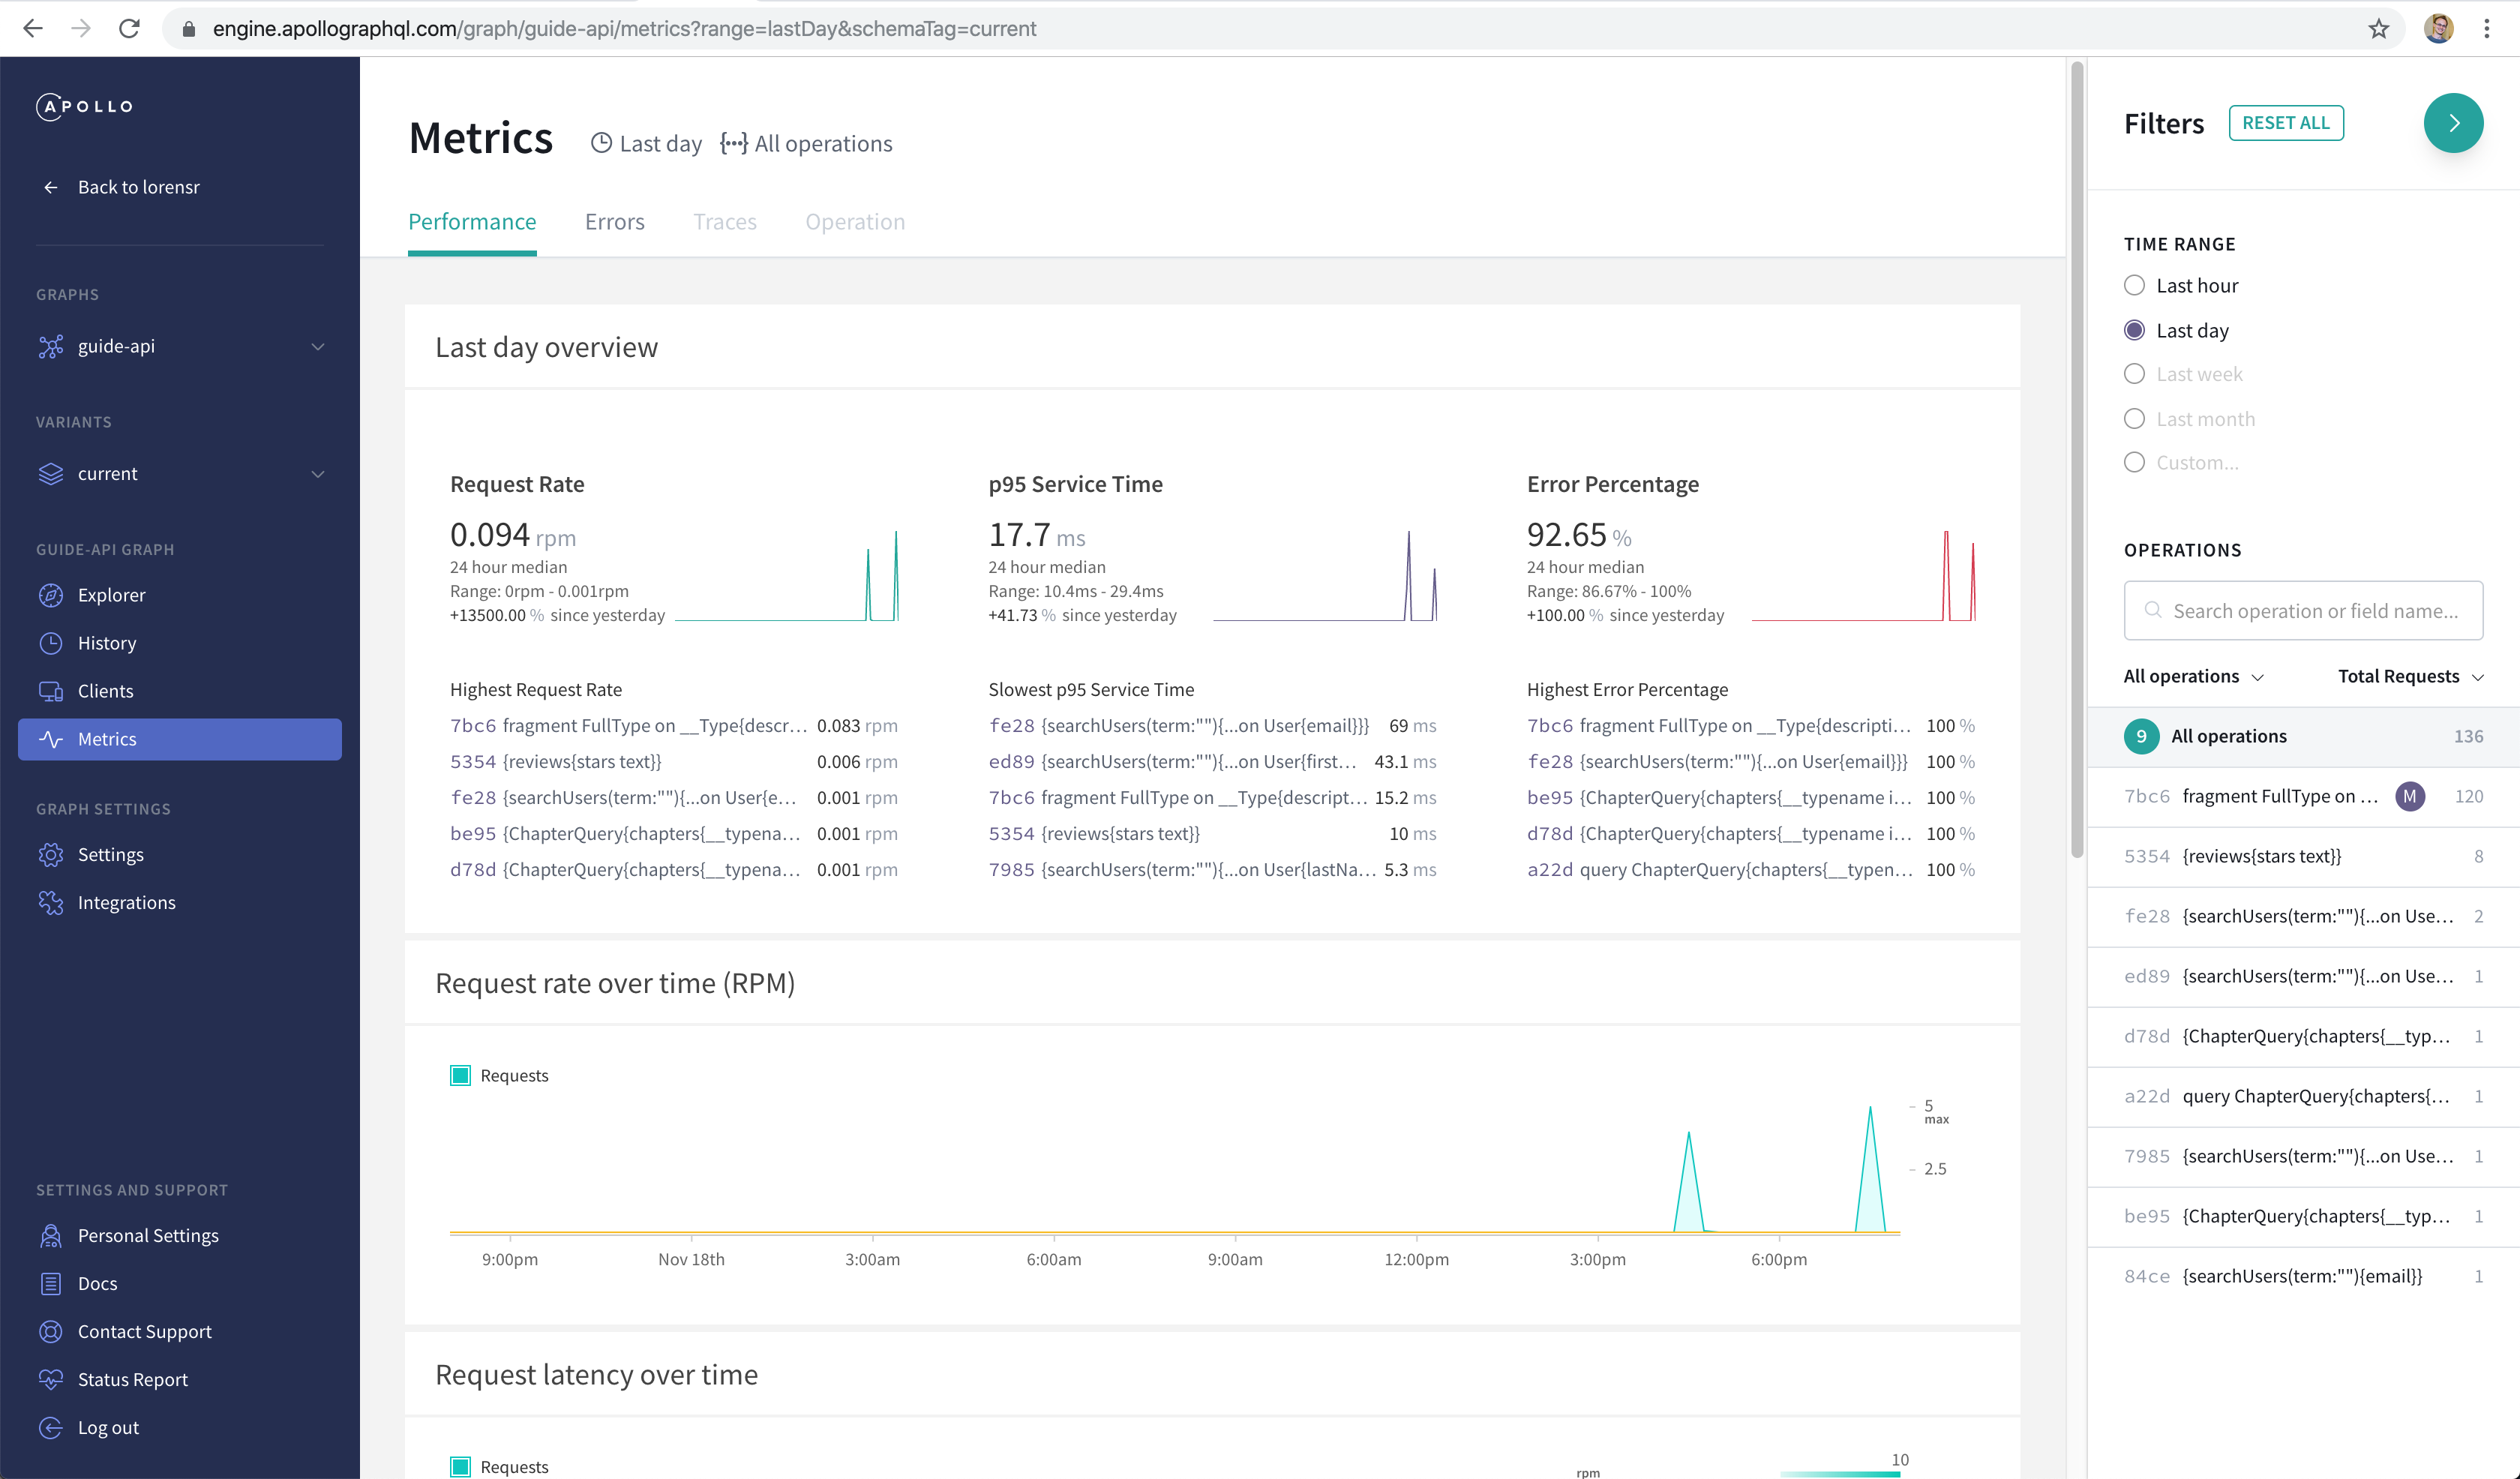
$ heroku config:set APOLLO_KEY="service:guide-api:*****"Here’s an example metrics dashboard:

The website UI has changed since time of writing, but it still contains all the same analytics. In the above image, we see:
- A low total request rate of 0.094 rpm (requests per minute). The operation with the highest request rate (0.083 rpm) begins with
fragment FullType, and it has 120 total requests, which we can see on the right in the Filters sidebar. - A low p95 service time of 17.7ms, which means 95% of requests are responded to within 17.7ms.
- A high error rate of 92.65%. Most of the errors come from the
fragment FullTypeoperation, which is sent by Playground to request the schema (and fails because introspection is disabled on this production server). - The request rate over time, and after we scroll down, request latency over time and request latency distribution.
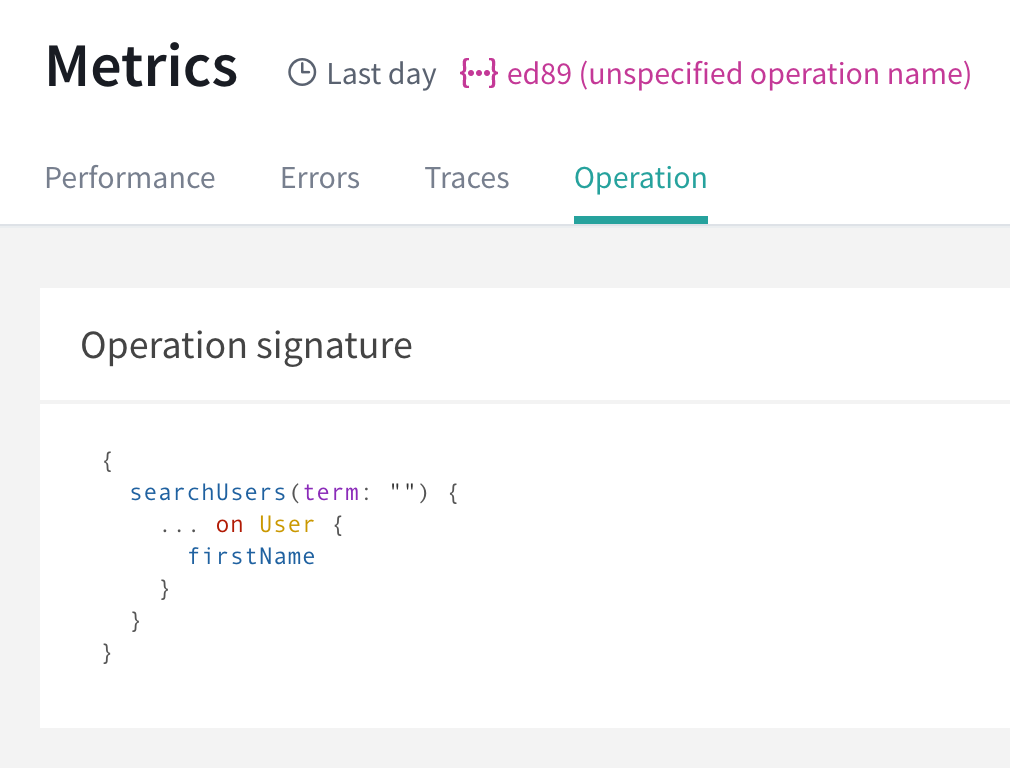
We can also see how difficult it is to differentiate unnamed queries—for instance, the four different searchUsers queries. To see which query has the second-slowest service time, we’d need to select it and then click on the “Operation” tab:

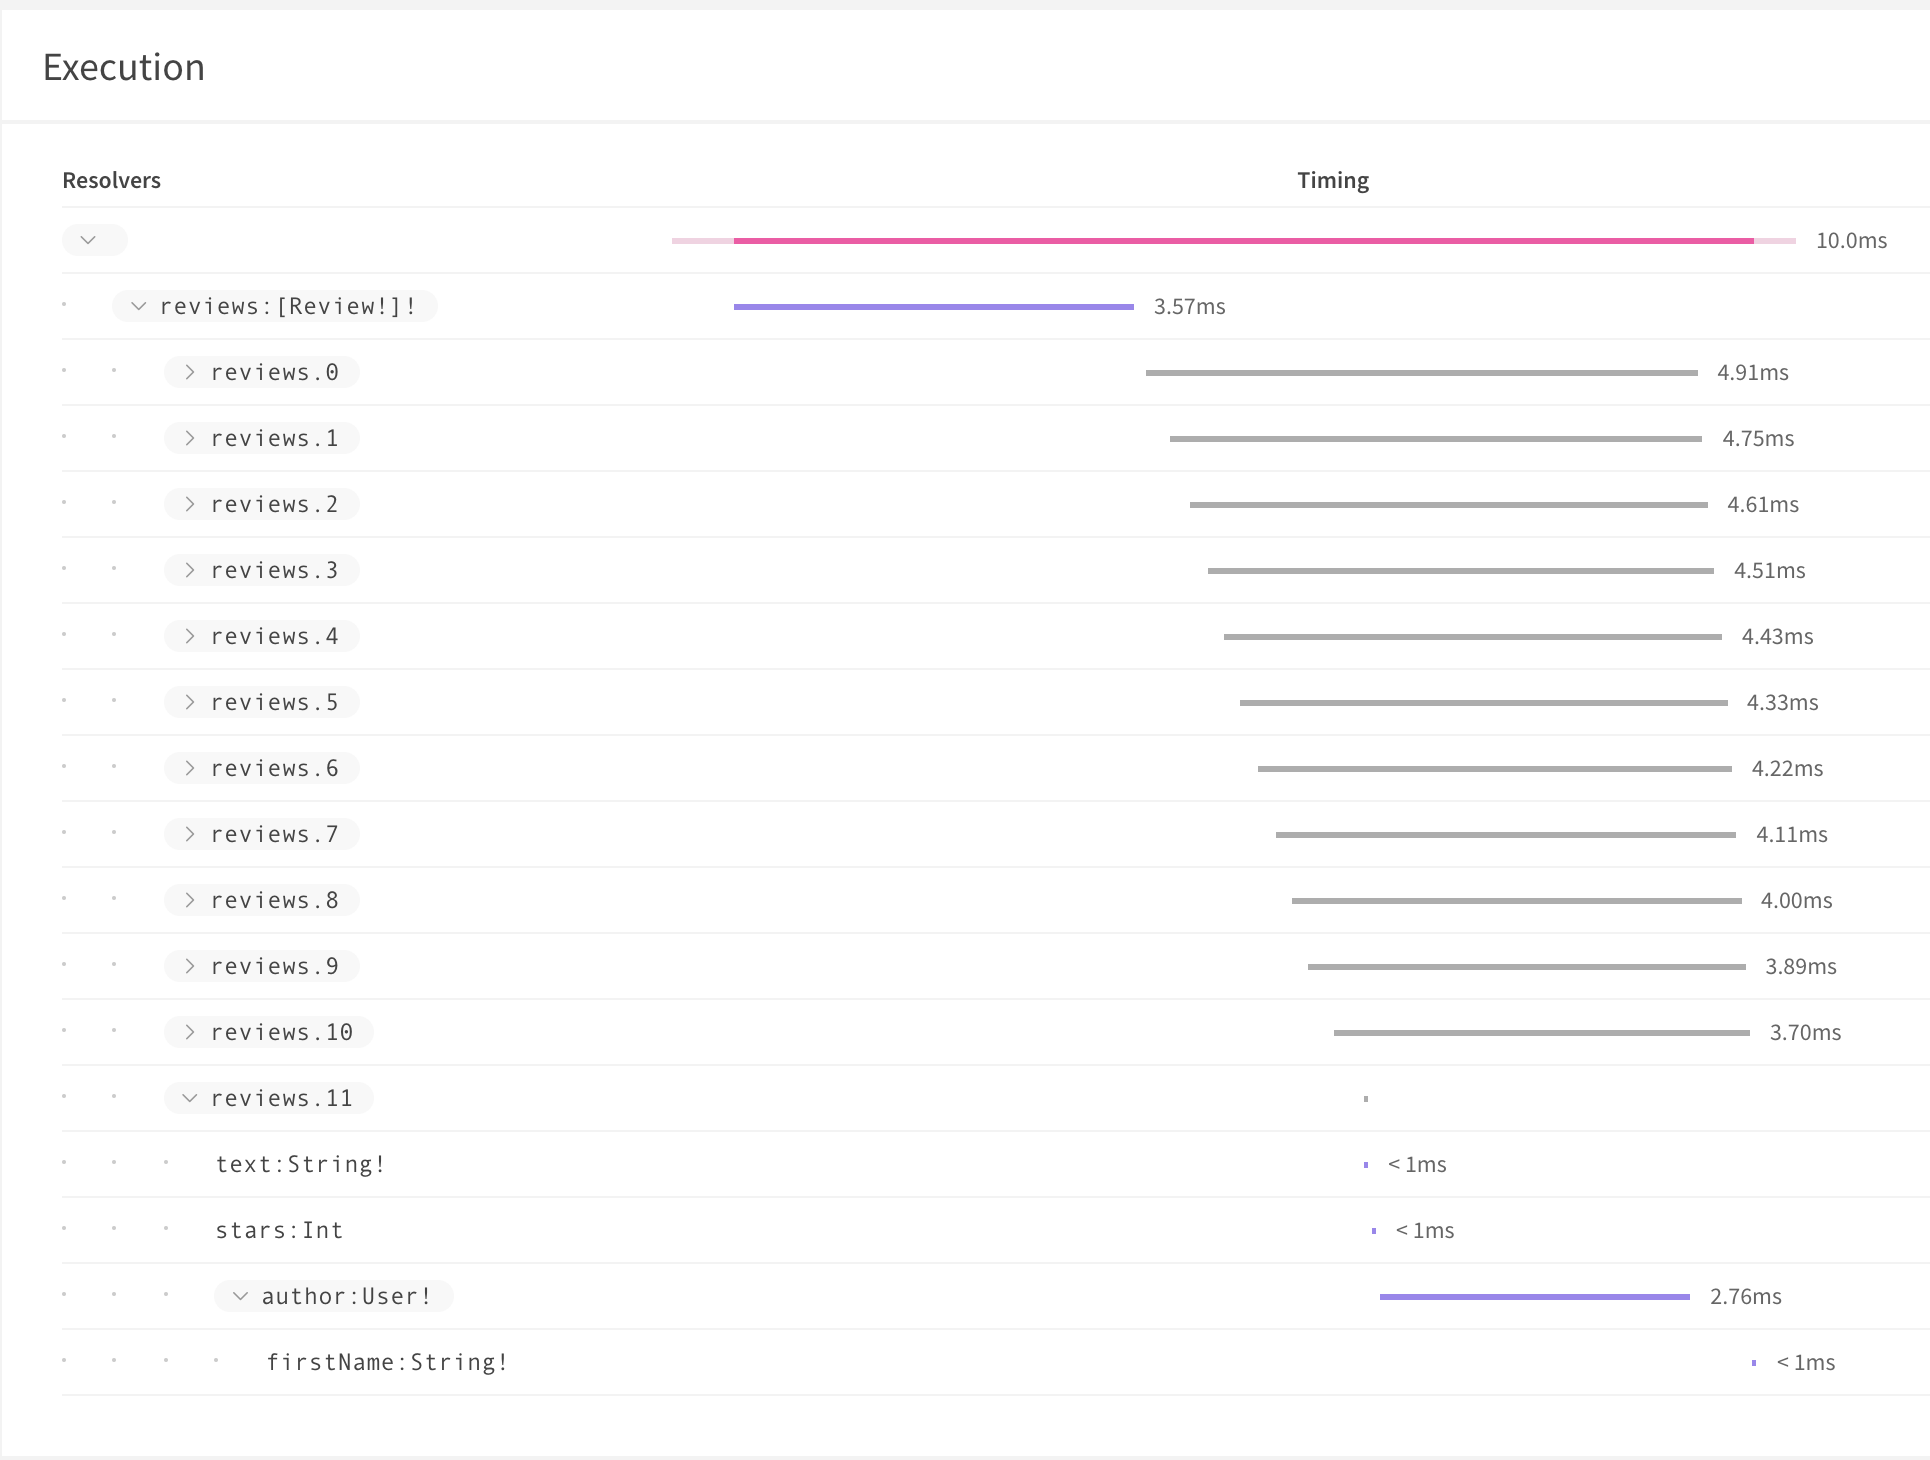
The “Traces” tab shows us the timeline of when resolvers are called and how long they take to complete. Here’s a reviews query and its trace:
{
  reviews {
		text
    stars
    author {
      firstName
    }
  }
}
The reviews resolver fetches the list of reviews, which takes 3.57ms, and then Apollo Server calls Review.* field resolvers, starting with the first review (reviews.0 in the trace), and ending with reviews.11, which is expanded so that we can see the timing of the field resolvers. Review.text and Review.stars return immediately, since they’re just fields on the review object, but Review.author requires a database lookup. That lookup is actually done in a single query for all reviews 0–11, as all the reviews have the same author and our datasource uses Dataloader, which deduplicates the 12 identical author queries. The query takes 2.76ms, after which the User.firstName resolver returns immediately, and the entire query response is ready to send to the client.
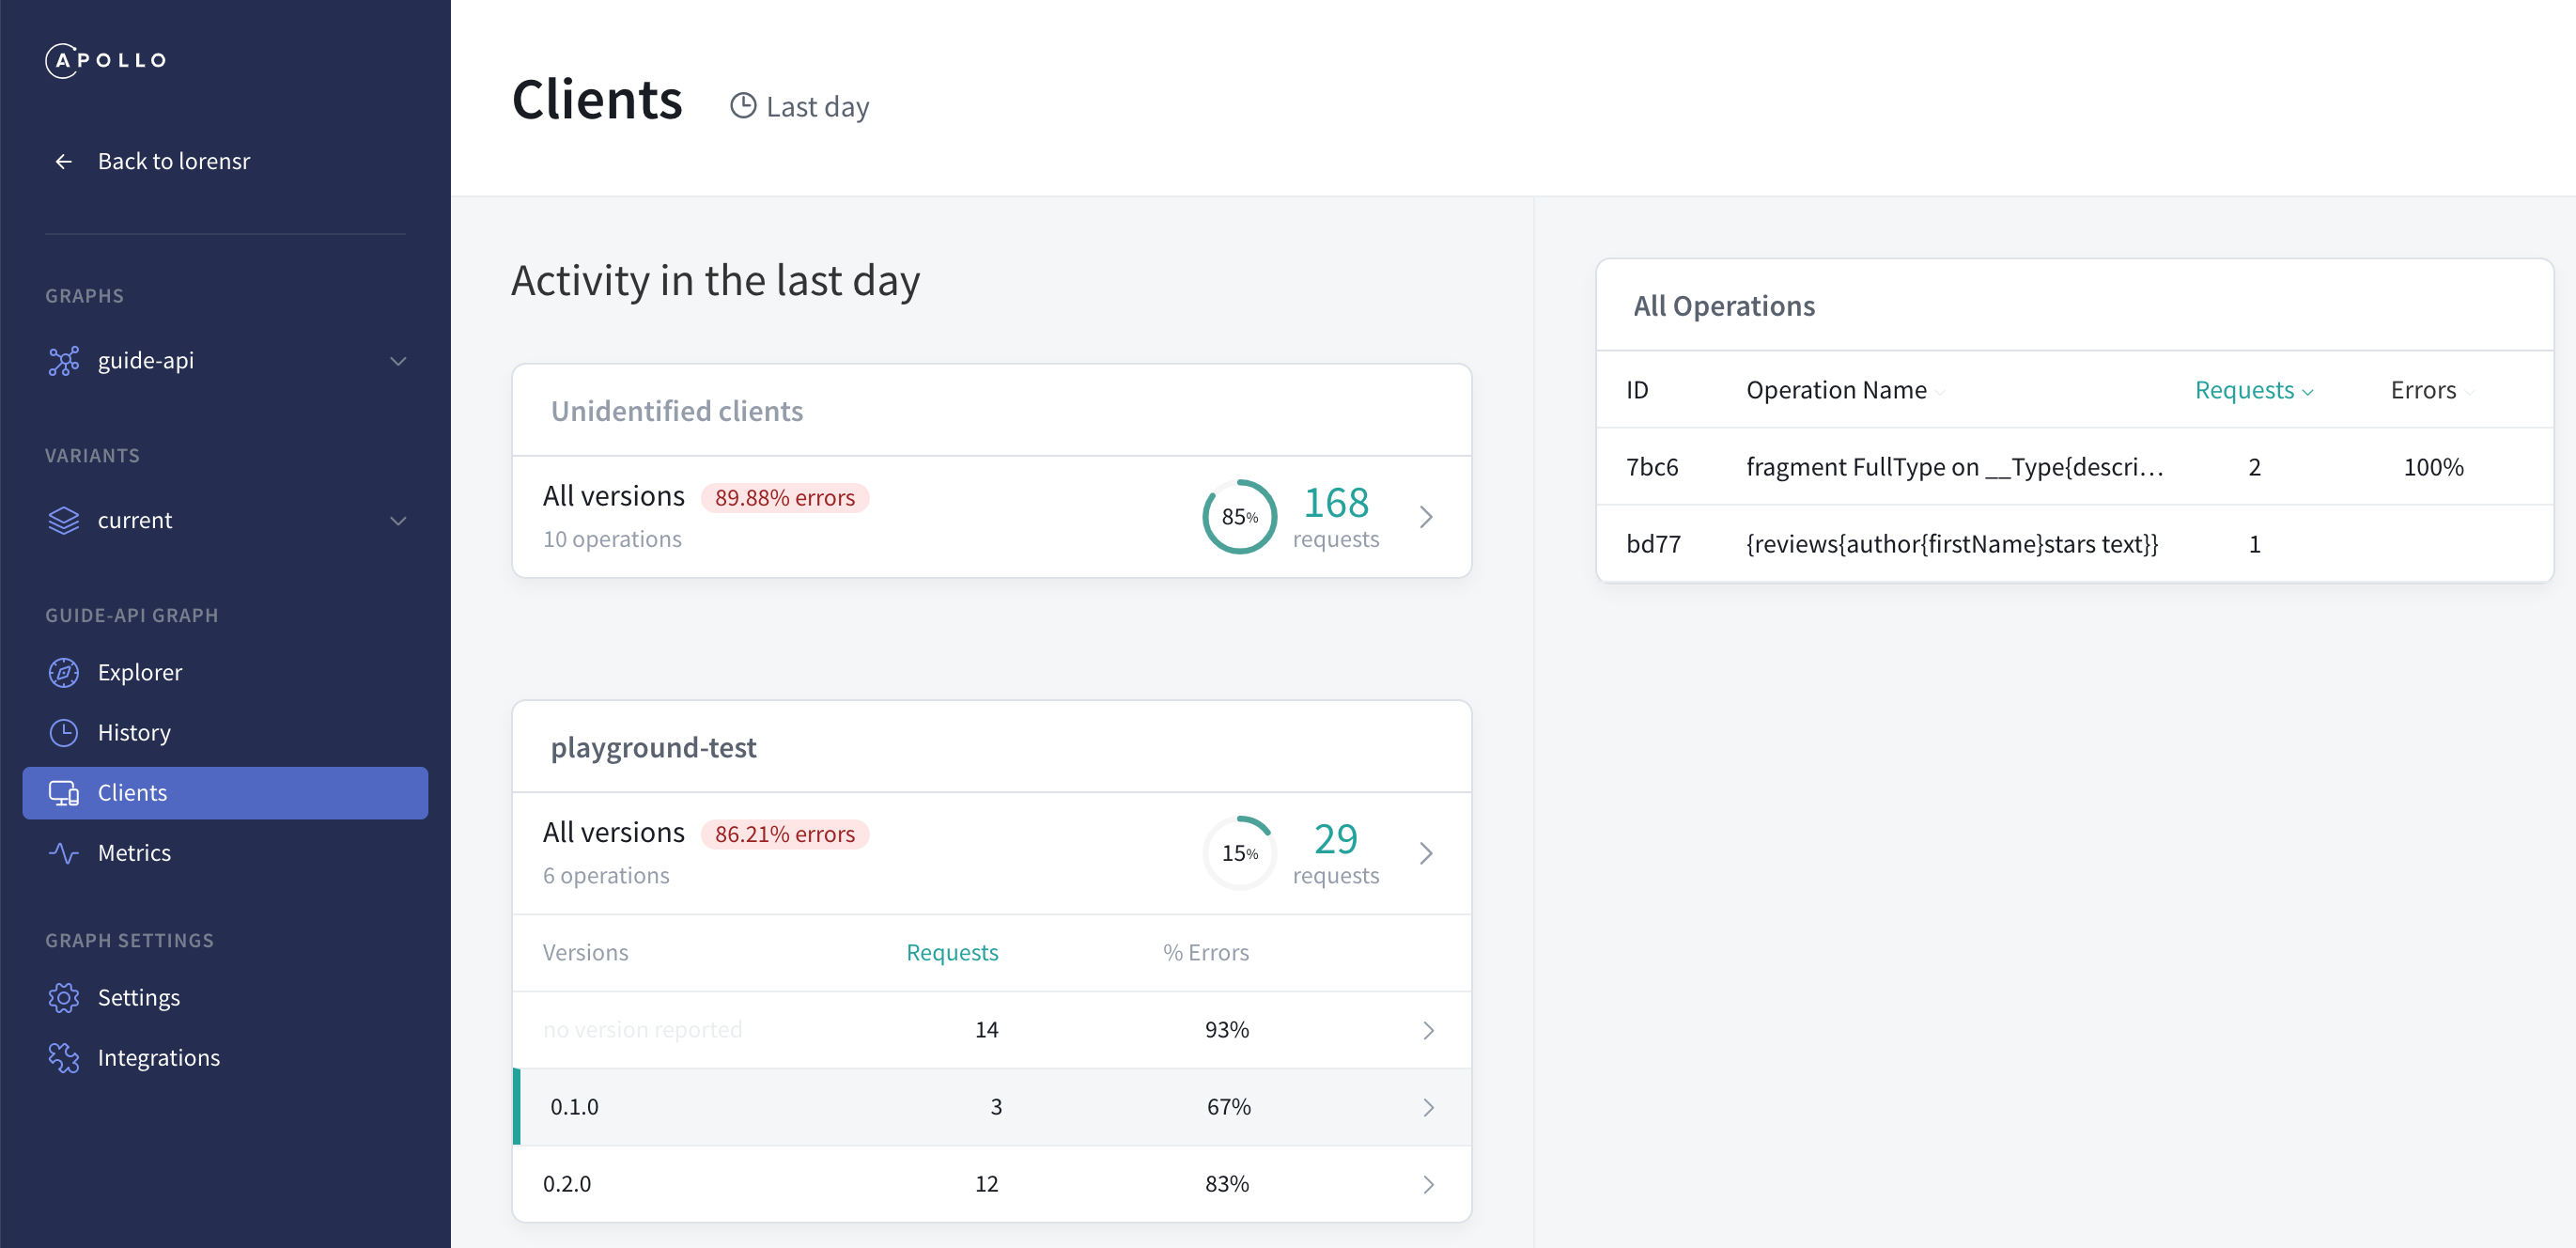
The Filters sidebar lets us filter by time range or by operation, but we can also filter by client type and version. To do that, we select “Clients” from the left sidebar. Now clients are listed on the left half of the page. Currently we only see one labeled “Unidentified clients” and “All versions.” That’s because none of our clients have identified themselves yet. They can do so by setting two headers, apollographql-client-name (like “webapp”, “iOS-app”, “marketing-script”, etc.) and apollographql-client-version (like 0.1.0, v2, etc.).
Let’s open the HTTP headers section of Playground and enter these:
{
  "apollographql-client-name":"playground-test",
  "apollographql-client-version":"0.1.0"
}
When using Apollo Client, we can use the
nameandversionconstructor options:new ApolloClient({ link, cache, name: 'web', version: '1.0' }).
Then, if we run a query, change the version, run more queries, and refresh Apollo Studio, we’ll see the new client type with two versions:

Selecting a version and then an operation on the right takes us to the metrics page of that query for that client version. We can also look at other operations used by that client in the Filters sidebar.